
Product
Energy Suite
Consumption treated as a process variable.
Energy Suite measures, historises and compares the consumption of a plant or a fleet of plants. Specific consumption per unit produced sits next to production, not on a separate spreadsheet, and every anomaly carries an estimate of what it is costing.
01
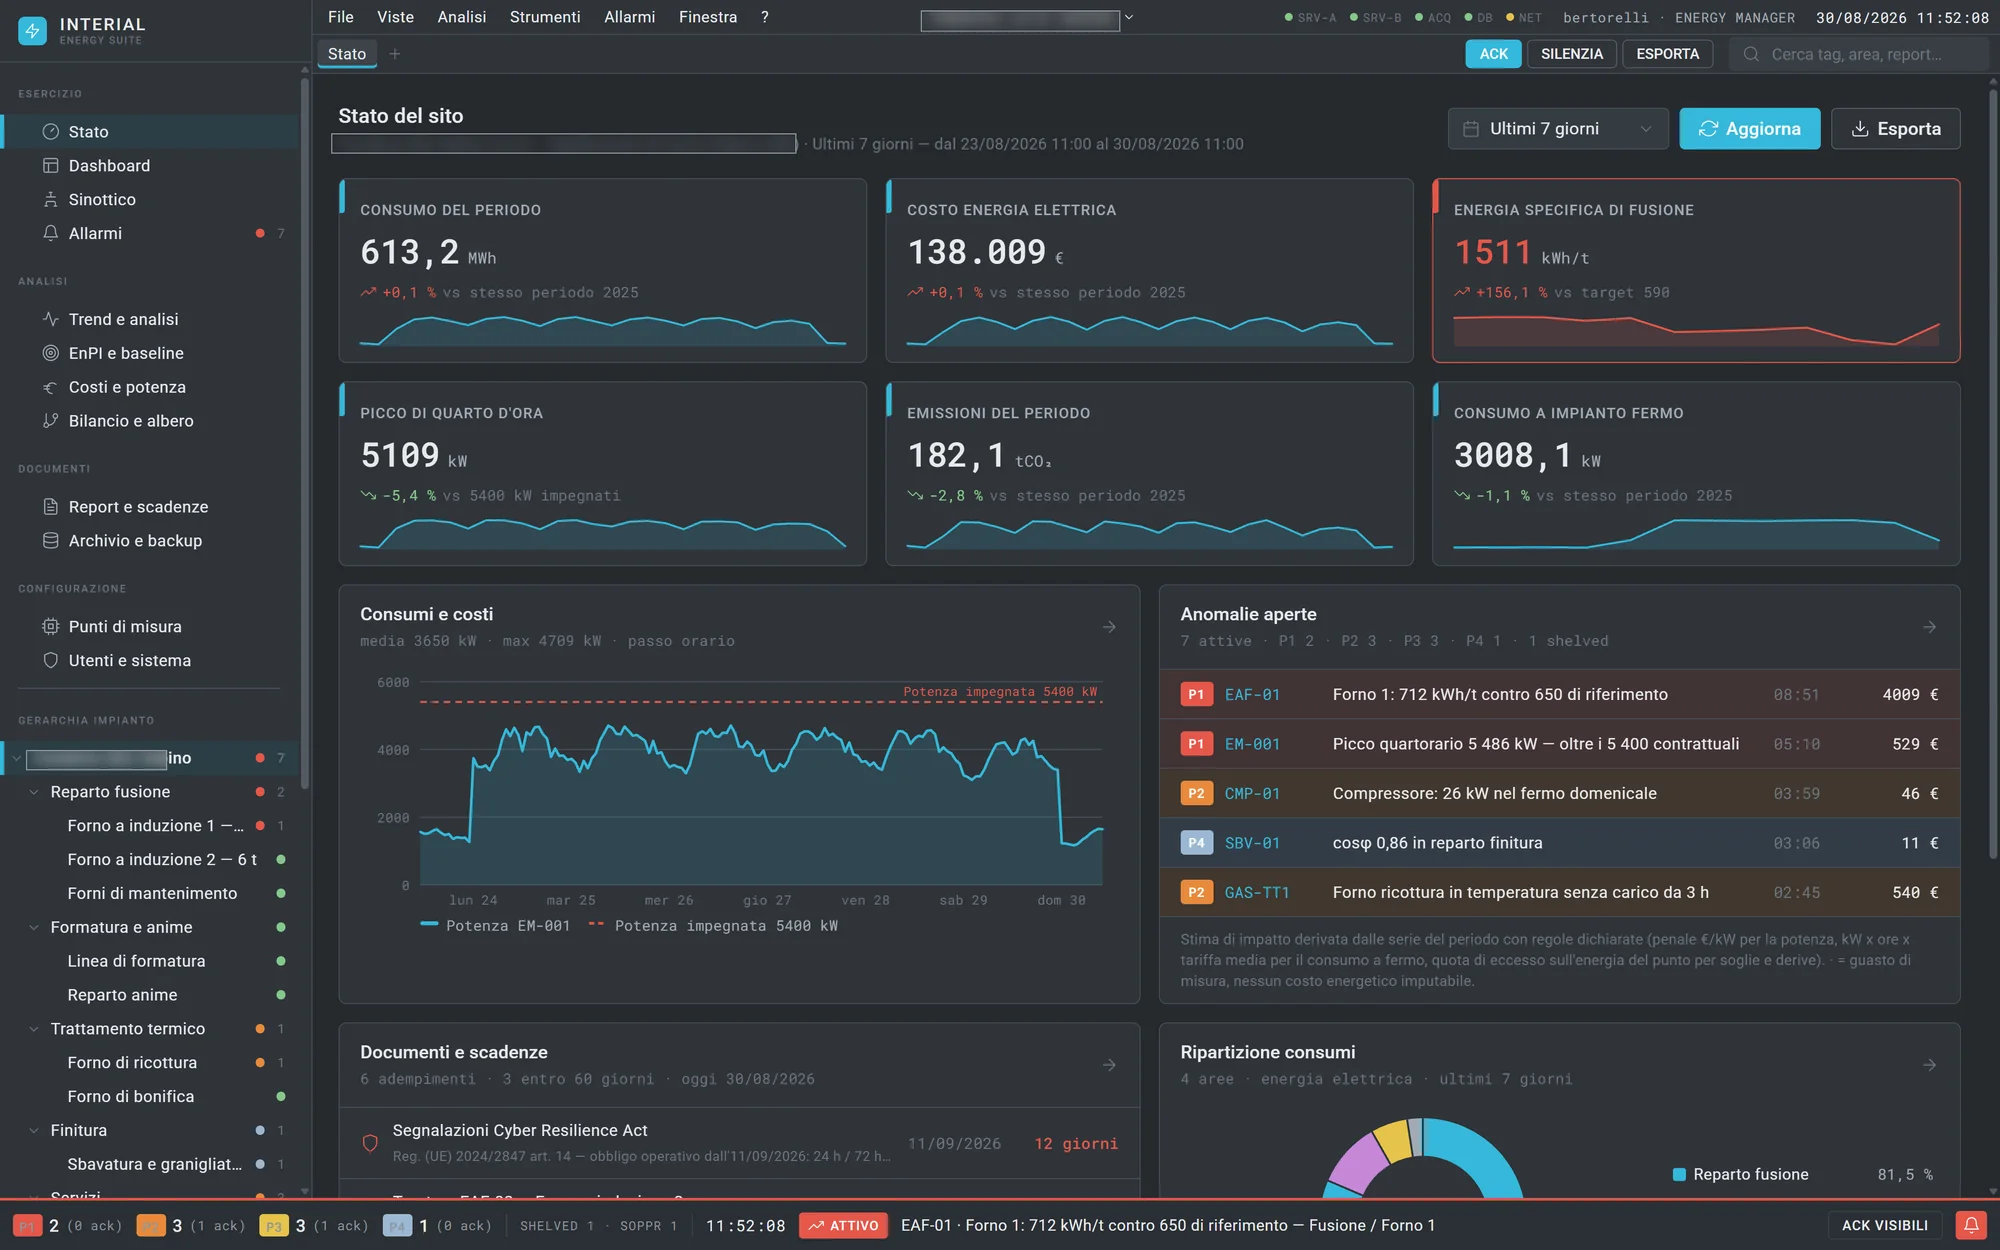
Anomalies carry a price
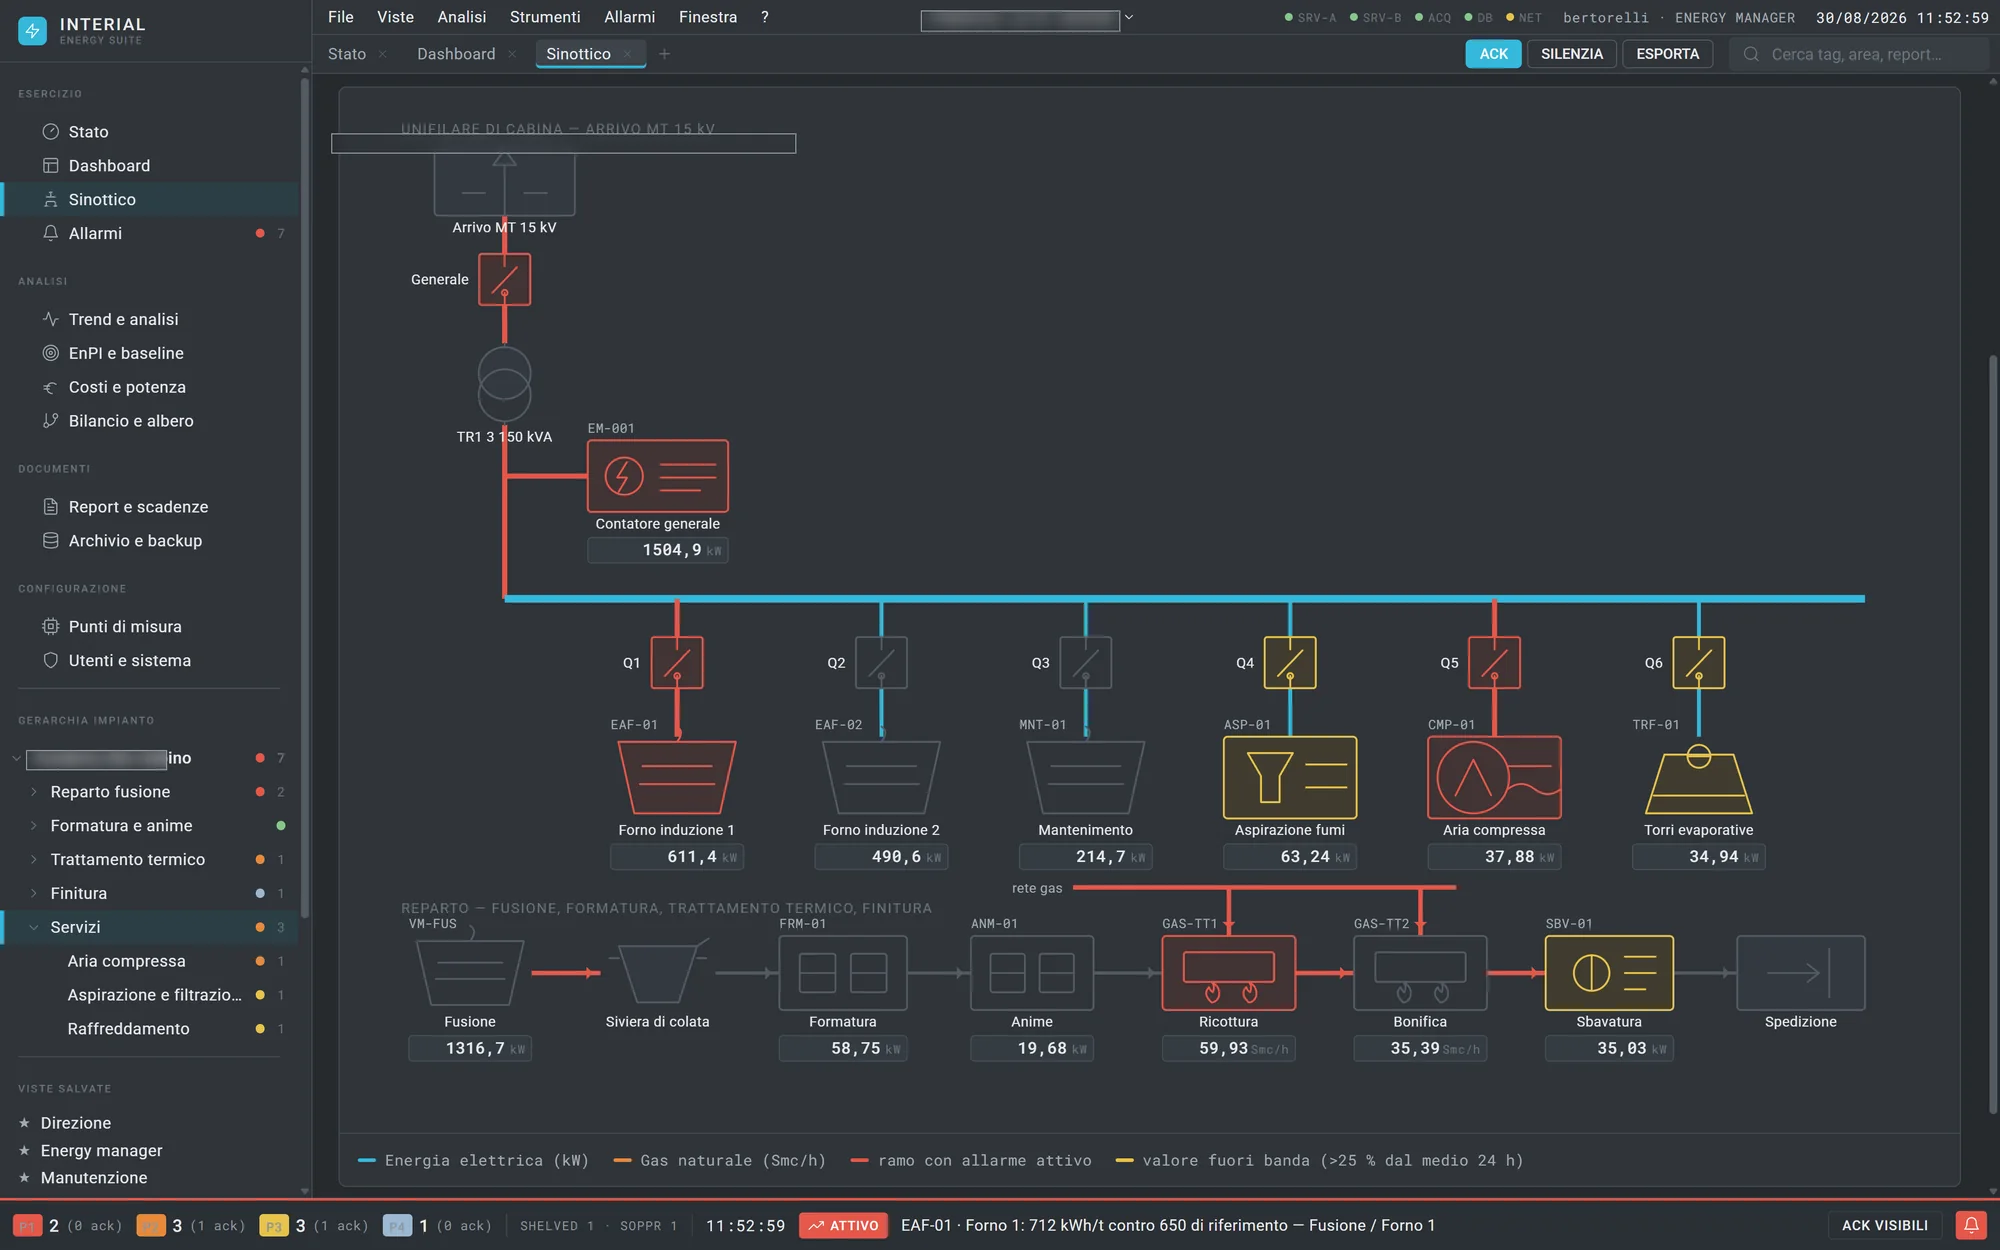
Every energy anomaly arrives with an estimate of its impact in euro, computed from the period series with declared rules: a penalty per kilowatt for exceeding contracted power, kilowatts times hours times average tariff for consumption while the plant is idle, the excess share on a point’s energy. A furnace consuming 712 kWh per tonne against a 650 reference is not a row in a table: it is four thousand euro.
02
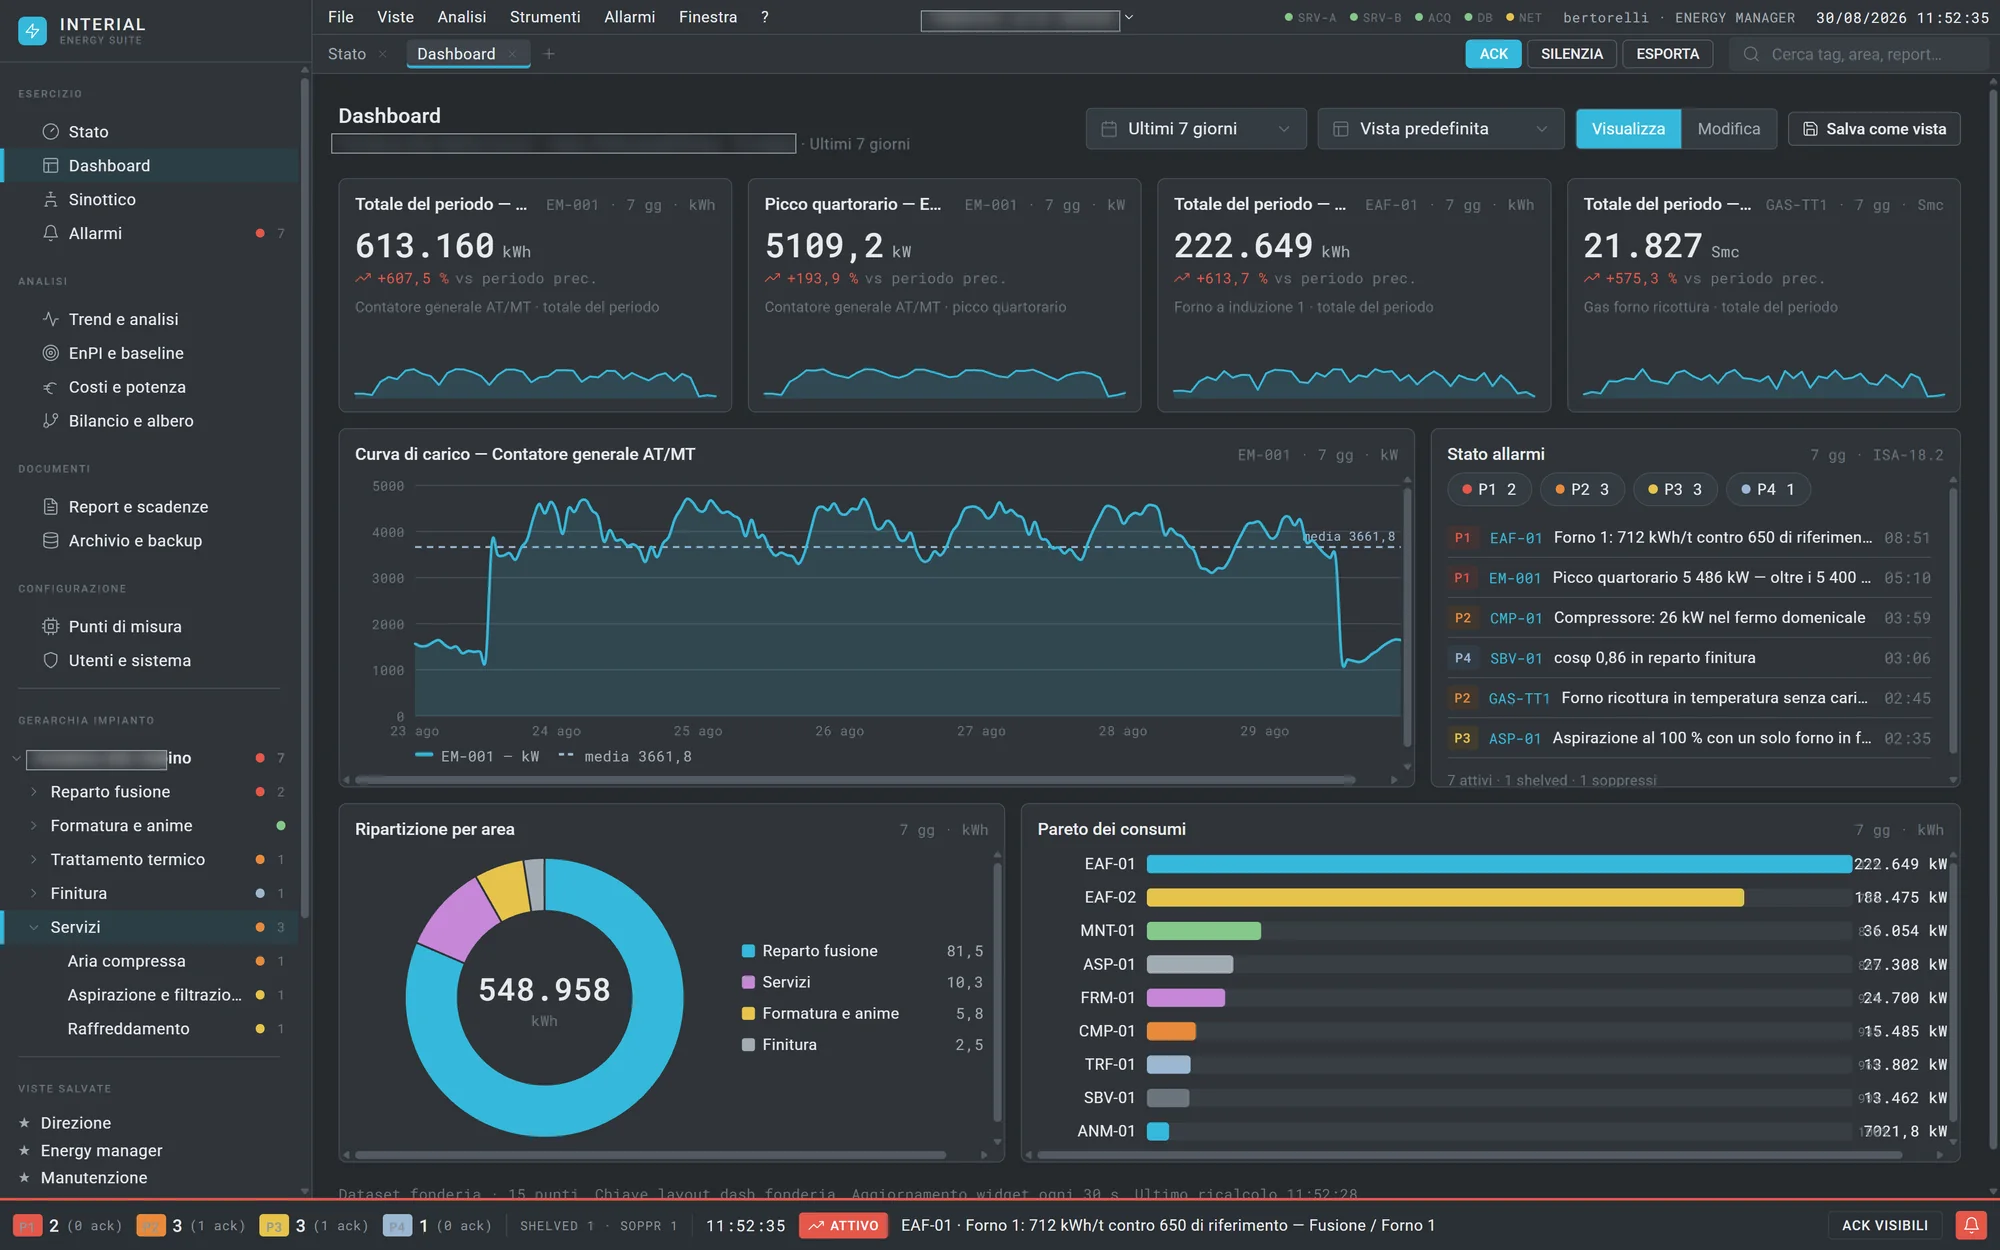
Energy balance and metering coverage
The balance follows carriers, grid electricity and natural gas, through to areas and end uses, and states openly how much is not metered. Site metering coverage is a front-page figure: the “unmetered” node is the difference between the main meter and the sum of sub-meters, and it is shown as a line of the balance rather than quietly distributed. The hierarchy follows EN 17267 and ISA-95, four levels from site to machine.
03
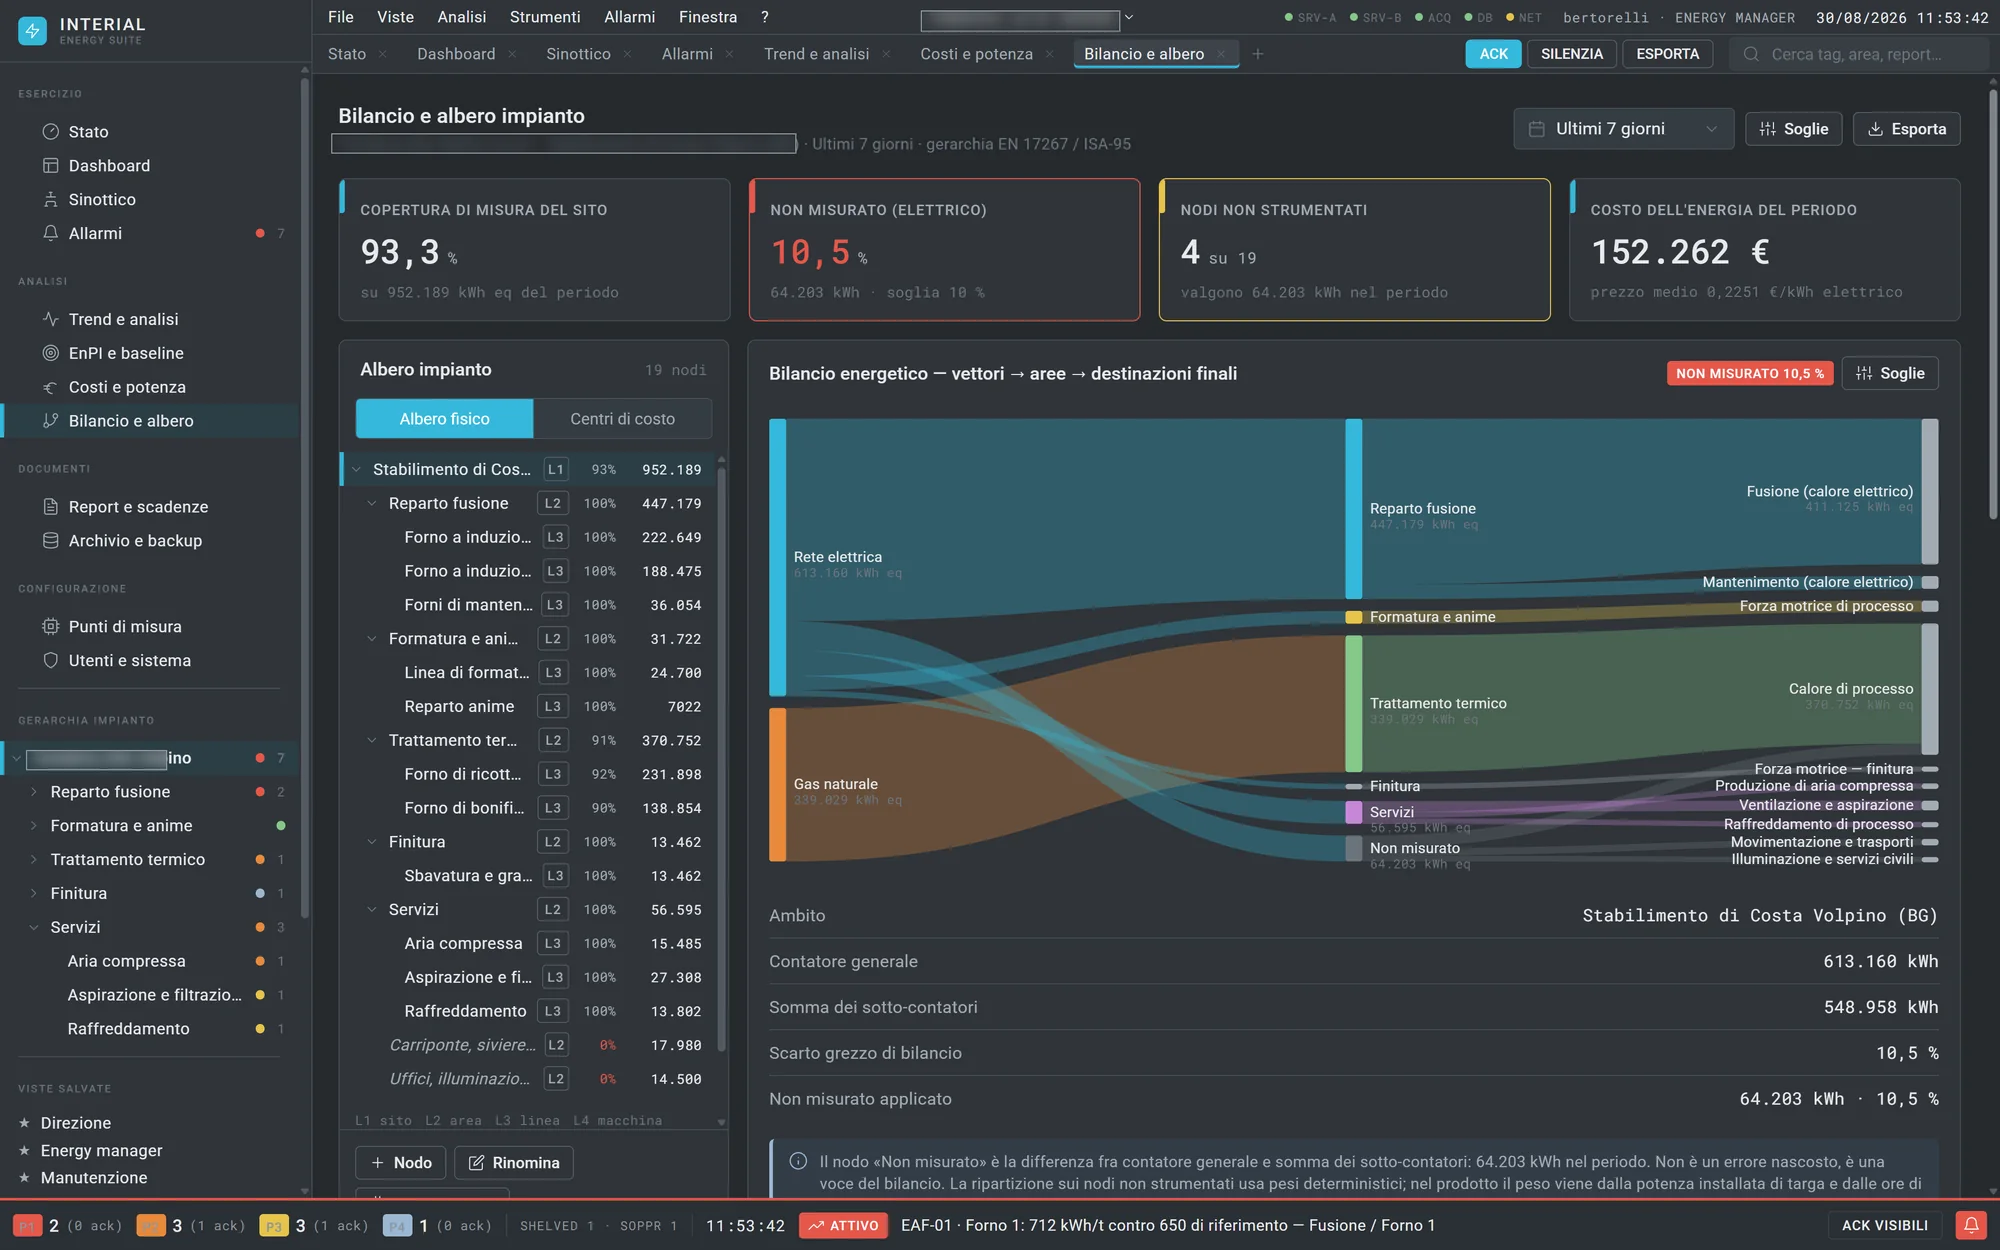
Costs, time bands and contracted power
Energy cost broken down by time band under the regulator’s scheme, with the energy share, levies and transport separated, and a weighted average cost per megawatt-hour. Contracted power is watched on the quarter-hour, which is the interval it is billed on: an overshoot raises an anomaly before it becomes a penalty on the invoice. Reactive energy has its own page, because power factor is paid for.
04
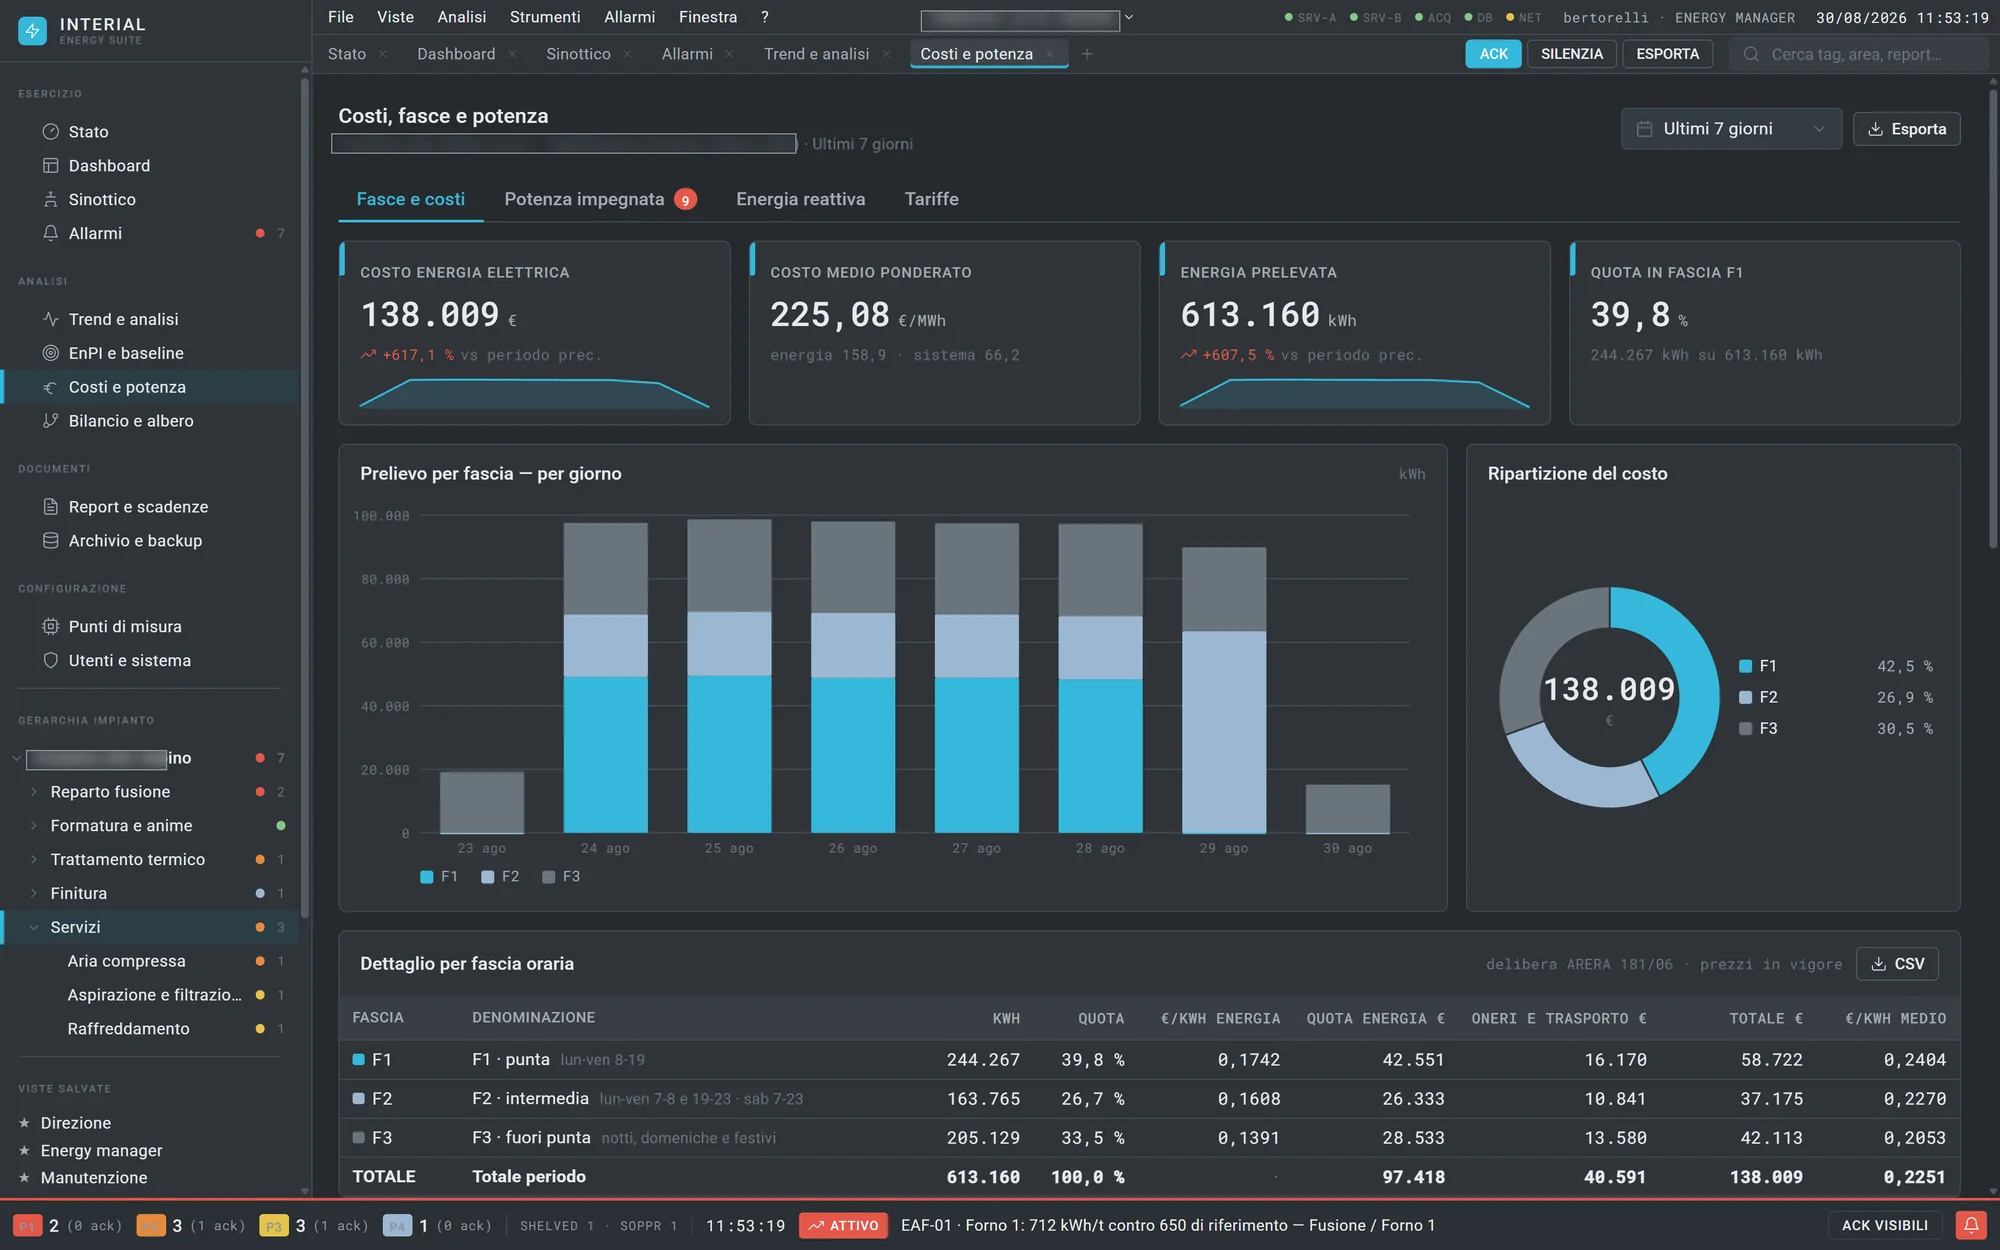
Energy mimic and analysis
The substation single-line diagram and the process line on the same screen, with the power drawn by each load and the branch in alarm highlighted. Above that, the analysis tools: multi-pen trends, heat map, duration curve and pivot table, with granularity from the quarter-hour to the month and period-over-period comparison.
It connects to the meters you already have
It connects to the meters you already have
Energy metering in a plant is almost always layered, and rebuilding it from scratch costs more than the saving you are chasing. The system adapts to what is there: recent power analysers, meters installed at different times, old pulse outputs, gas and water meters, with industrial protocols covered natively and a gateway or a custom connection where needed. Consumption flows out through REST APIs, WebSocket and MQTT to the ERP and to management control, with no spreadsheets travelling by email. We also handle the measurement plan and the installation of the instruments, and over the years we keep the system alive: tariffs updated, baselines revised, history preserved, through to automating loads when measurement turns into action.
Protocols covered by the platform
- Modbus/TCP
- OPC UA
- MQTT
- SNMP
- BACnet
- IEC 60870-5
- IEC 61850
- DNP3
- S7
- S7Plus
- EtherNet/IP
- S-Bus
- SSI
- Pulse
Archiving beyond ten years
Archiving beyond ten years
An energy audit happens every four years, comparison against the baseline holds for the life of the plant, and a tariff dispute can concern years long closed. Energy history is therefore a long-term archive, not a buffer: high-volume time series separated from configuration data, retention declared per variable, export in open formats and verifiable backup.
- Series kept at acquisition rate, not only aggregated
- Export in open formats with period, measurement point and calculation rule
- Verifiable backup and exercised restore
- Data stays readable beyond the life of the version that wrote it
Tell us about the plant.
Even just to find out whether the problem is in our field. You get a technical opinion back.